Issued Saturday, December 3rd 2022: There are currently no active tropical systems across Australia’s region of responsibility. All model data is remaining quiet in the short term.
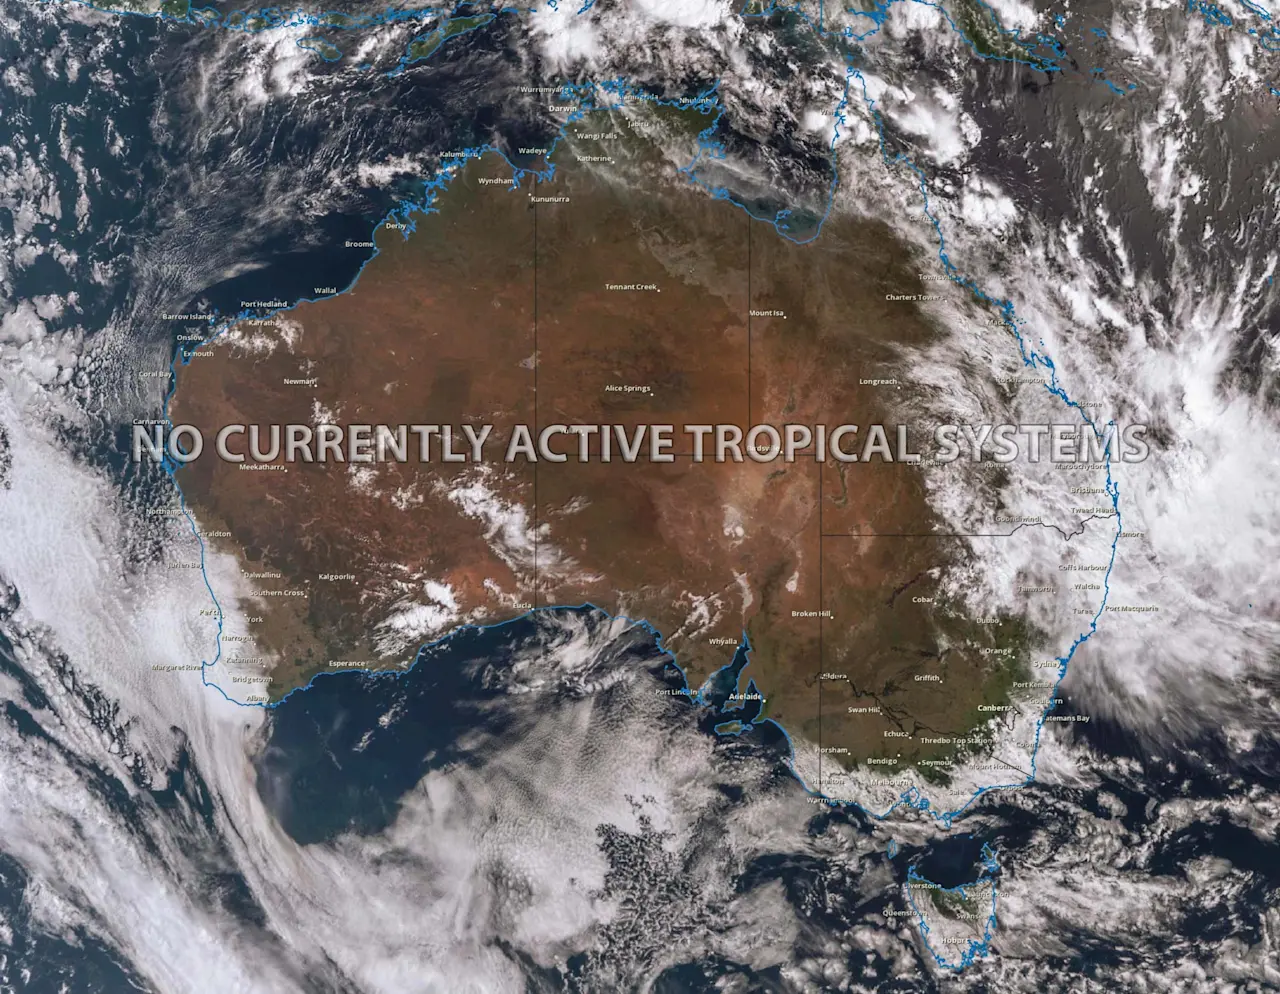
Issued Saturday, December 3rd 2022: There are currently no active tropical systems across Australia’s region of responsibility. All model data is remaining quiet in the short term.
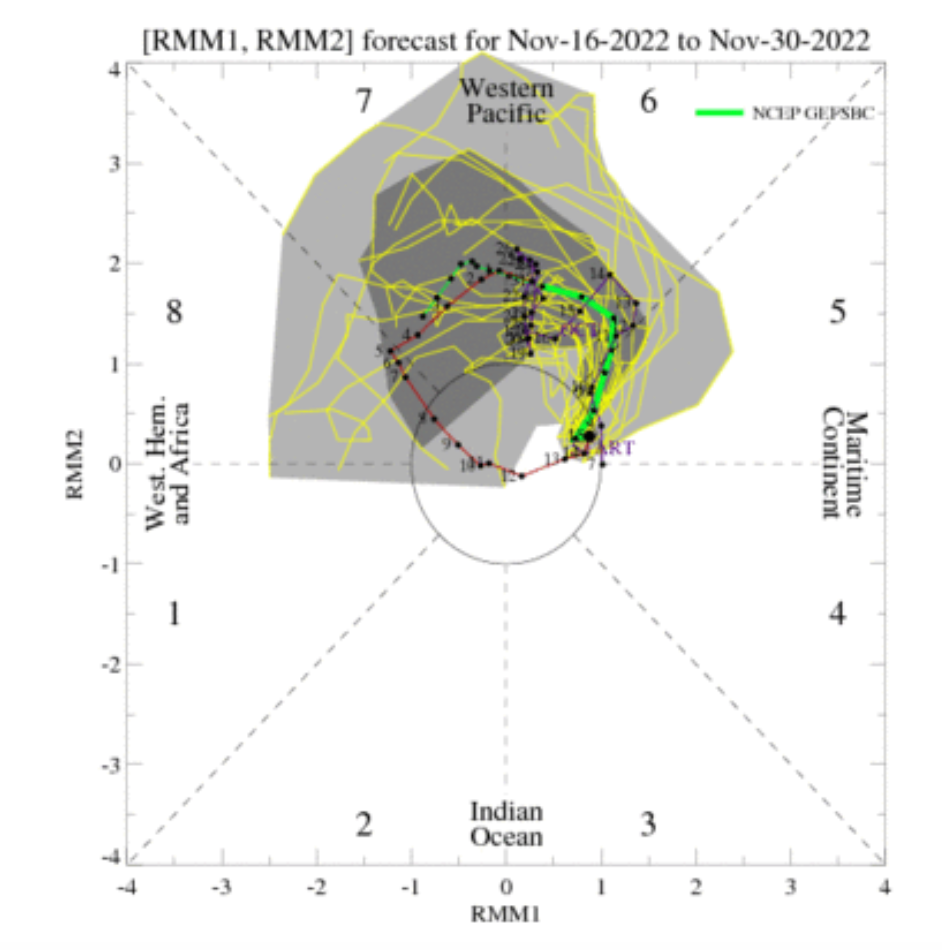
Issued 17th November 2022: After a long period of inactivity during October the MJO is currently located over the Maritime Continent. During the next few weeks it is forecast to strengthen and shift East into the Western Pacific. The monsoon trough currently remains north of Australia though this positive phase MJO is likely to cause any increase in tropical rain and storm activity across Northern Australia. Longer range forecast data suggests a Tropical Low or cyclone may develop across Northern Australia in the Gulf of Carpentaria then track South West into inland NT with heavy rain.
The MJO is an atmospheric tropical wave that moves from west to east through equatorial regions every 30 to 40 days. Depending on it’s positive values, when the MJO is located 5 and 7 it causes a significant increase in tropical activity across Australia. Very often tropical lows and cyclones form during a positive MJO.
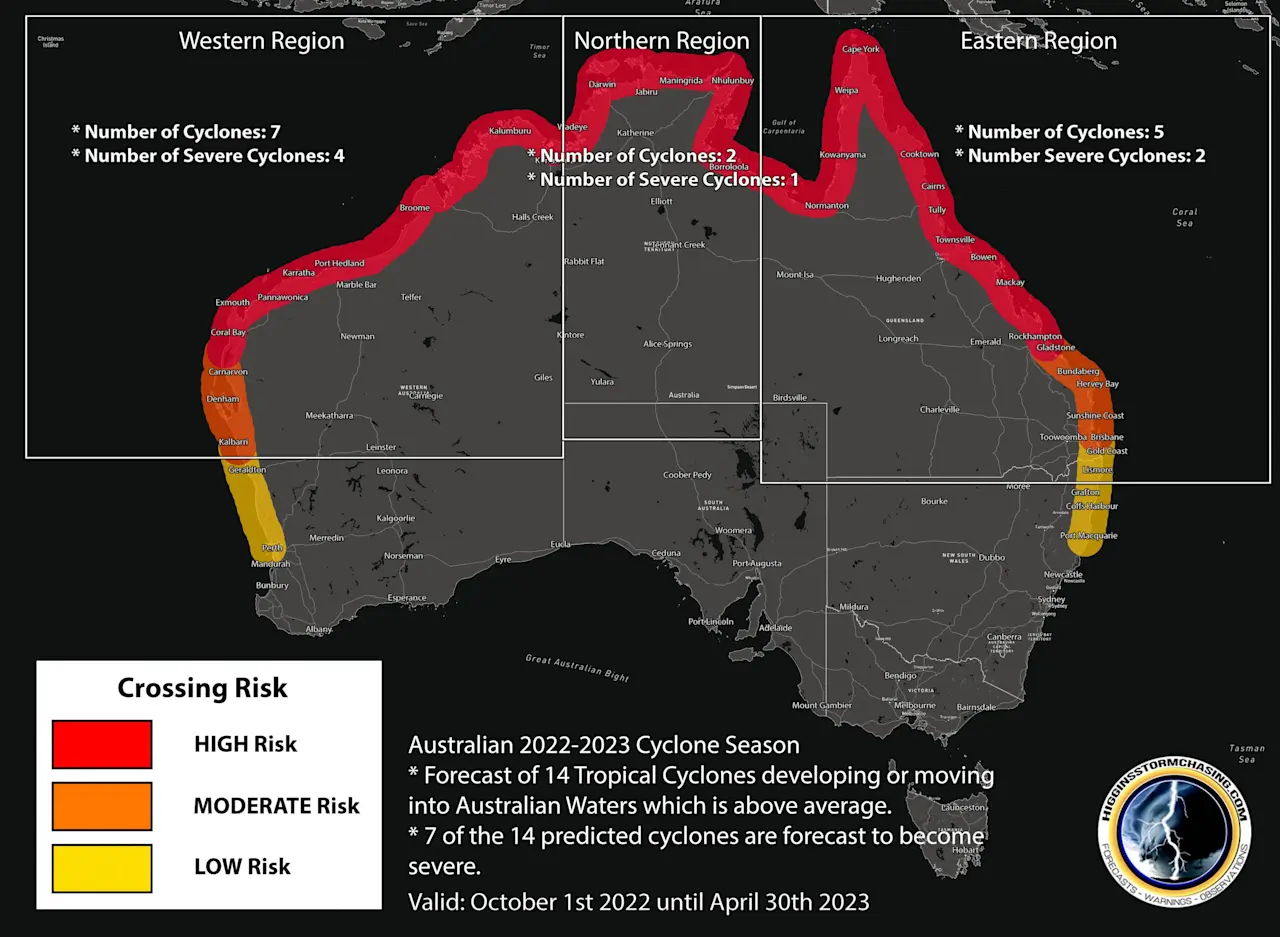
Issued 8th September 2022. We are forecasting an above average number of tropical cyclones across our Australian cyclone area of responsibility.
In the Western Australia area we are predicting a total of 7 systems with 4 reaching a category 3 or greater.
For Northern Territory which includes the western Gulf of Carpentaria a total of 2 systems with 1 category 3 or greater.
In the Queensland area which includes the southern and eastern Gulf of Carpentaria we are predicting a total of 5 systems. 2 of these are expected to reach category 3 or greater.
In addition to cyclones we are expecting over 20 tropical lows to develop.
Given the higher forecast numbers we have extended the high and moderate risk areas further south down the QLD and WA coastline. The low risk areas include Ex Tropical systems which now extends into NENSW and down to Perth.
It is IMPOSSIBLE to predict the number of coastal crossings and exactly where. Each year, even during La Nina and negative Indian Ocean Dipole events have inconsistent coastal impacts. The more that do develop the bigger the risk to land areas and it only takes 1 category 3,4 or 5 to cause widespread destruction. Ex TCs and tropical lows have also recently caused major widespread flooding and devastation.
Given the current state of key climate drivers a number of cyclones could develop before Christmas with the peak between January and April 2023. Be sure to keep a close eye on our MJO forecast below along with any WATCH areas we identify on the satellite map above. Tropical cyclone track and intensity maps will be issued when a system is expected to reach cyclonic strength within 4 days.
Updates and warnings will be issued through email alerts and our new Higgins Weather app.
Issued *SAMPLE * TEST ONLY*