La Nina / El Nino, Indian Ocean & SOI


Ocean Overview for November 2022

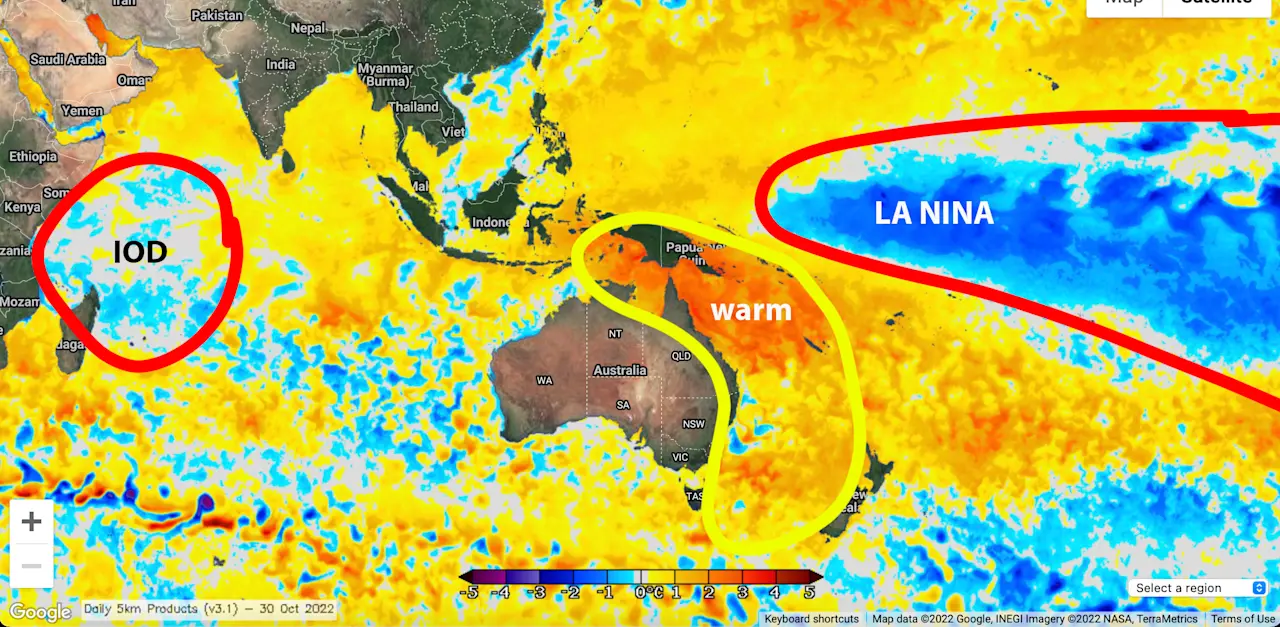
La Nina and a weakening negative Indian Ocean Dipole remain active and have both peaked in intensity. Warmer than normal sea surface temperatures surround Australia with significant warming across Northern and Eastern regions. These 3 combinations will likely cause a significant risk of increased tropical lows and cyclones + intensity, above average rainfall and a high risk of flooding across large parts of Australia through the remainder of Spring and Summer. Very moist tropical winds are continuing to feed in from the North West (Indian Ocean) and the North East (Coral Sea / Pacific) which are converging in over Australia. Image via NASA

La Nina IOD November 22nd


Pacific Ocean ENSO (La Nina / El Nino) November 2022 - May 2023

UPDATED 17th of November 2022: During October and early November the La Nina 3.4 & 4 sea surface temperatures has remained near -1.0C below average which is at La Nina values (Below image 1). 

A majority of Global forecast data suggests that La Nina will remain in place at these levels until December 2022 before warming and transitioning back to neutral during the first quarter of 2023 (Below image 2). Subsurface ocean temperatures remain below average in the Central Pacific which will aid the La Nina pattern in the short term. Low level easterly trade winds remain stronger than usual along with suppressed rainfall and cloudiness the the 3.4 and 4 Nino regions indicating a coupled La Nina ocean and atmosphere. All of this means a very high risk of above average rainfall and an increased risk of flooding for Northern and Eastern Australia during the next 5 months. Into early 2023 La Nina is forecast to steadily weaken back to neutral however residual above average rainfall is likely to continue. Images via CPC

ENSO Current 17th November 2022ENSO Forecast 17th November 2022


Southern Oscillation Index

UPDATED 17th of November 2022. The Southern Oscillation Index is currently +7. The 30-day Southern Oscillation Index was +11.1. The 90-day SOI value was +13.5.

The SOI has been strongly positive since May and remains just above La Niña levels.

Sustained positive values of the SOI above +7 typically indicate La Niña while sustained negative values below −7 typically indicate El Niño. Values between +7 and −7 generally indicate neutral conditions. Source: BOM

SOI November 2022


Indian Ocean Dipole

UPDATED 17th November 2022. The latest Indian Ocean Dipole value is -0.3C which is now above the negative event thresholds. All global model data is forecasting the IOD event to continue weakening through November before becoming fully neutral by December.

A negative IOD often brings above average rainfall through Spring across large parts of Australia.

The current weak negative IOD in combination with La Nina in the Pacific Ocean is expected to lead to above average rainfall and a significantly increased risk of flooding across large parts of Australia during the next 5 months. Increased Madden-Julian Oscillation cycles impacting Australia are also likely to increase tropical activity and rainfall in the coming months. The MJO information is updated on the tropical cyclone page. Below Image: BOM

IOD November 2022


SAM - Southern Annular Mode

UPDATED 17th November 2022. A positive Southern Annular Mode (SAM) has been persistent during the past few weeks. Forecast data suggests SAM will weaken to near neutral this week. A positive SAM pushes more frequent low pressure systems and cold fronts up from the Southern Ocean further north over Australia. These result in increased rain and storm events.

SAM has a short forecast range of 2 weeks ahead. Image via CPC

AAO 17th November 2022